The online survey aimed to evaluate whether TwinArch is complete, useful, and usable across application domains of Digital Twin systems. Respondents evaluated three key hypotheses:
- H1. Completeness: The Architectural View adequately represents all necessary elements.
- H2. Usefulness: The Architectural View provides practical value for DT design and development.
- H3. Perceived Usability: The Architectural View is intuitive and easy to apply in practice.
The online survey comprised four phases: (i) subject selection, (ii) questionnaire design, (iii) results analysis, and (iv) data reporting.
Subject Selection
To evaluate TwinArch completeness, usefulness, and perceived usability, survey participants were identified through three main sources: (i) authorship and contact details from papers referenced during the TwinArch design, (ii) advertisements on social media and forums, and (iii) recognized experts in Digital Twin research. A total of 20 DT experts participated in the survey, consisting of 9 industry practitioners and 11 academic researchers.
Summary of Representative Profiles
| ID | Experience | Affiliation | Role | # Individuals |
|---|---|---|---|---|
| P1 | 1 year | Industry | DT Developer | 2 |
| P2 | 1 year | Academia | Assistant Professor | 1 |
| P3 | 1-3 years | Industry | Research Engineer | 2 |
| P4 | 1-3 years | Academia | Researcher/Assistant Professor | 6 |
| P5 | >3 years | Industry | (Senior) Research Engineer | 5 |
| P6 | >3 years | Academia | Associate/Full Professor | 4 |
Questionnaire Design
The questionnaire was organized into six sections, comprising a total of 23 questions with a mix of closed and open-ended formats. The first section gathered background information about the respondents, while sections two through five focused on TwinArch’s architectural views. Each of these sections included closed questions with a rating scale from Strongly Disagree to Strongly Agree to assess three key quality factors for each view. The final section evaluated the overall TwinArch proposal and included open-ended questions, allowing participants to elaborate on their responses and provide additional insights, including potential strengths and limitations they identified.
The questionnaire is available at: Questionnaire for TwinArch Validation.
Result Analysis and Reporting
The responses were captured using a Likert scale shown in Figure 1. The majority of respondents (65–80%) agreed or strongly agreed that TwinArch is complete. Practitioners highlighted its comprehensive architectural coverage and emphasized its potential to address the current lack of a Digital Twin reference architecture.
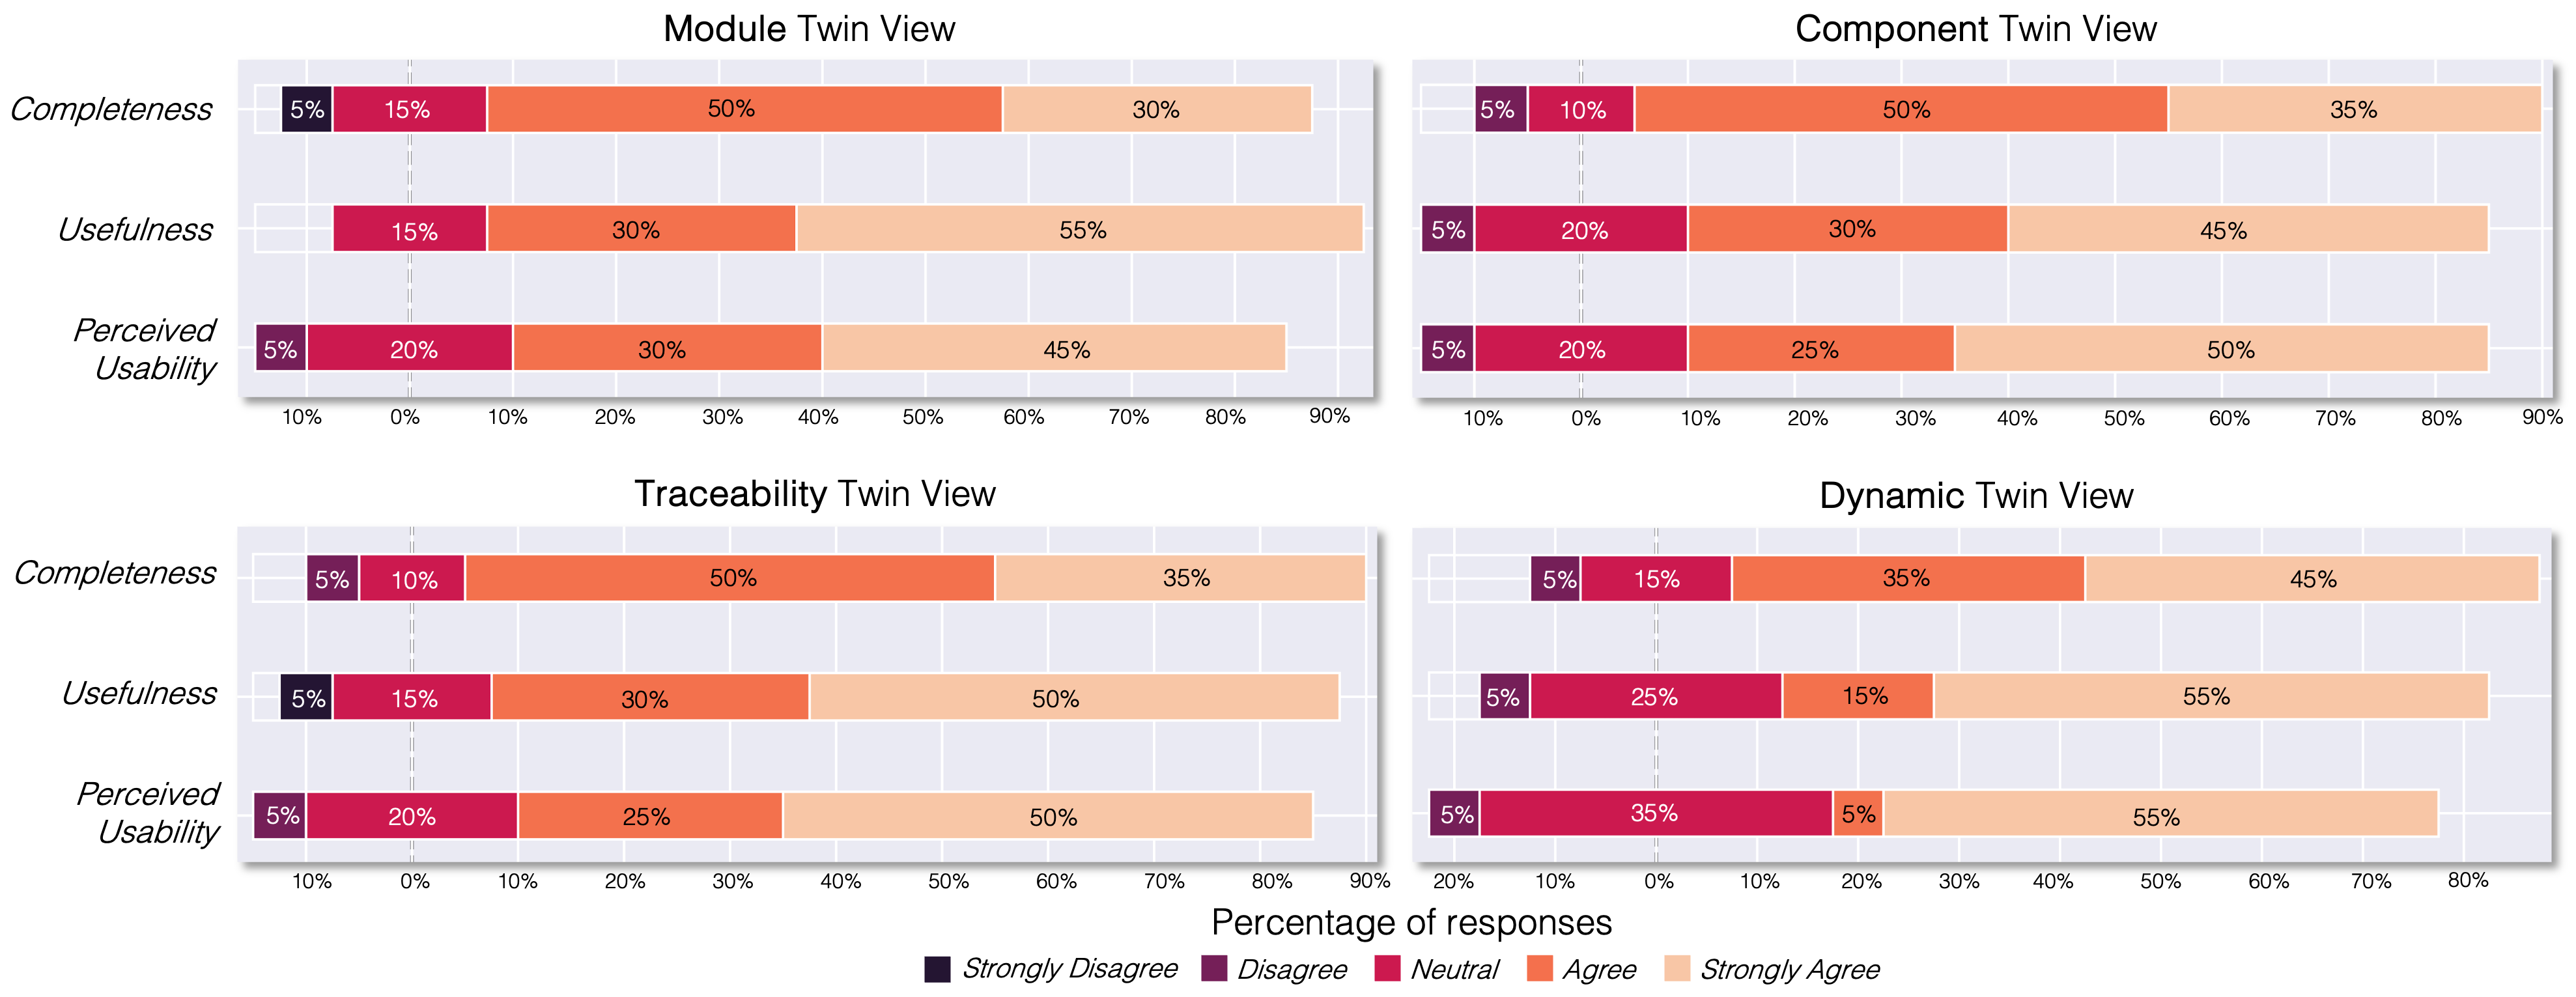
Figure 1: Likert plot of questionnaire responses.
Moreover, 45–55% of respondents strongly agreed that TwinArch provides practical value, particularly for fostering collaboration between stakeholders and guiding development through well-structured guidelines.
Regarding perceived usability, although the feedback was generally positive, the scores were slightly lower compared to completeness and usefulness. Practitioners pointed out challenges related to practical examples and the need for customization to fit domain-specific applications.
Statistical and Practical Significance
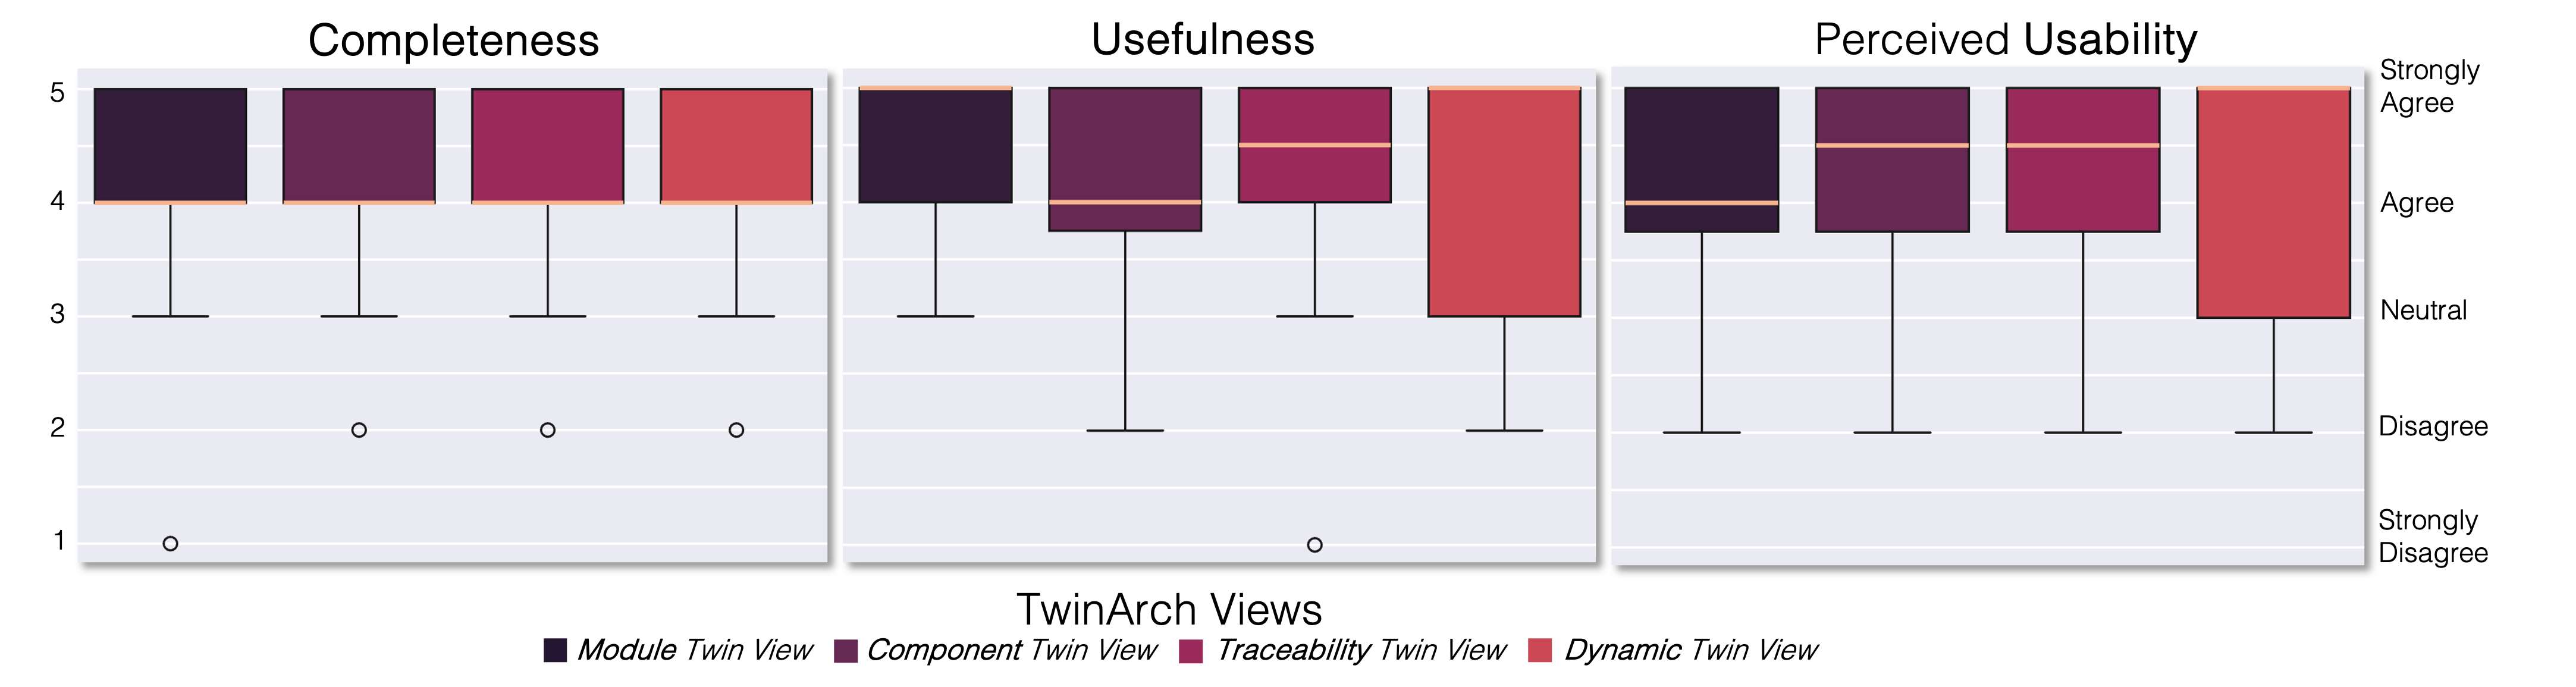
Figure 2: Box plots comparing online survey responses.
To further analyze the responses, a Wilcoxon signed-rank test was conducted to determine the statistical significance of the hypotheses. The results confirmed that the responses were significantly positive across all views and attributes as shown in Figure 3.
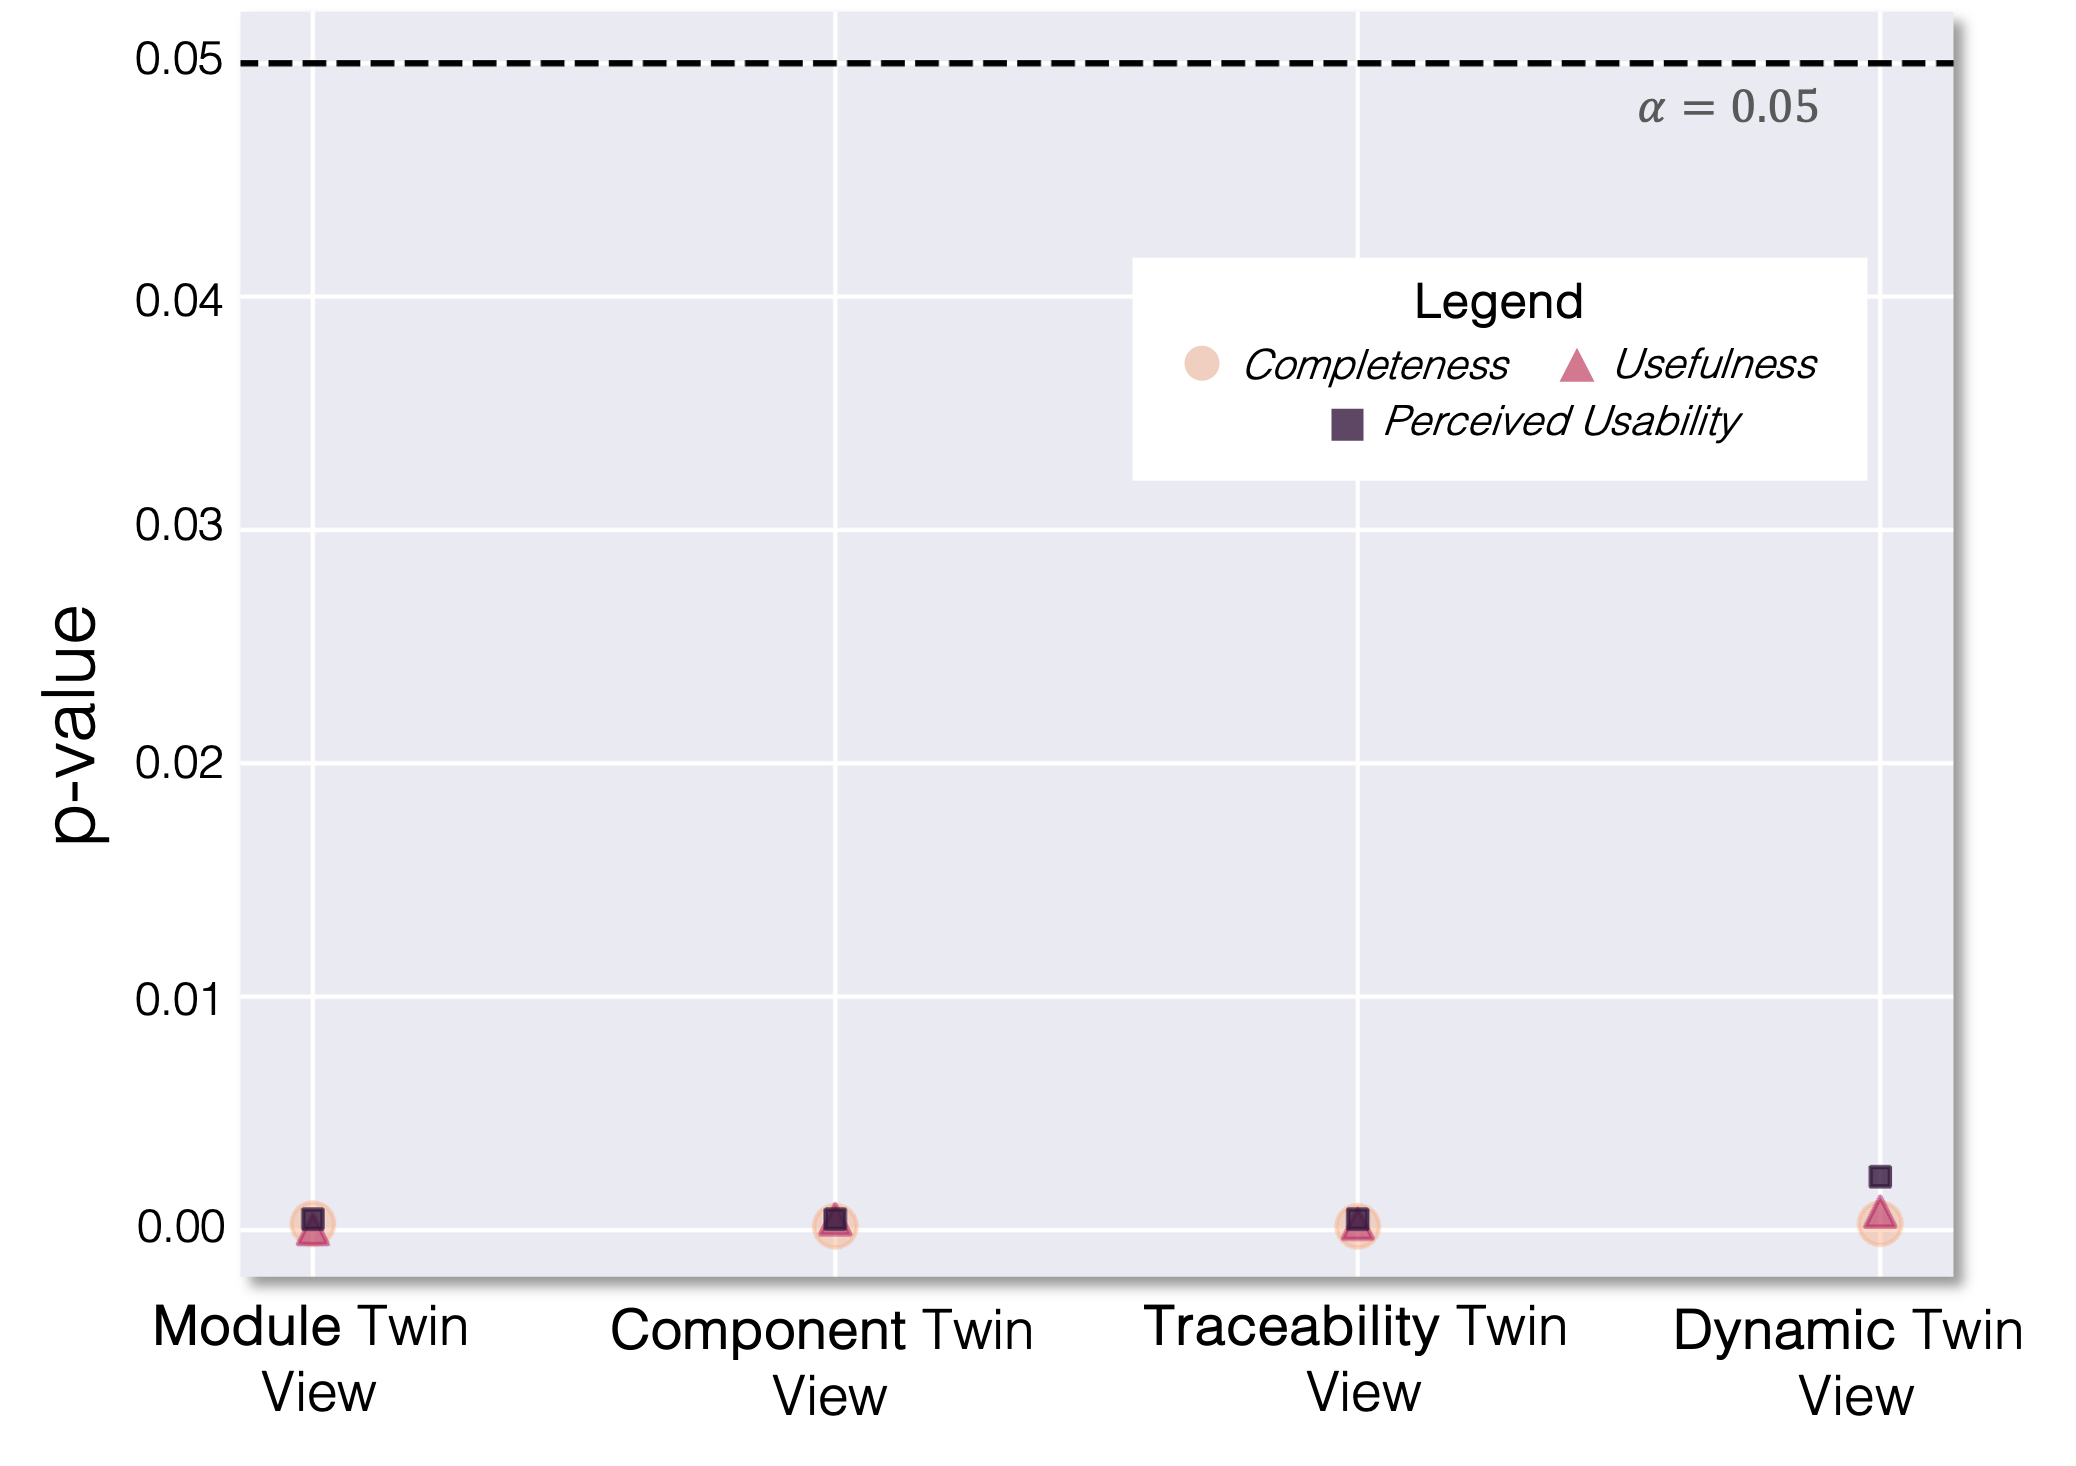
Figure 2: Wilcoxon test results.
Additionally, the practical significance of the findings was evaluated using Cohen’s effect size measure, which indicated a large effect across all attributes. Completeness and usefulness were especially notable, while perceived usability, though slightly lower, still demonstrated strong practical utility.
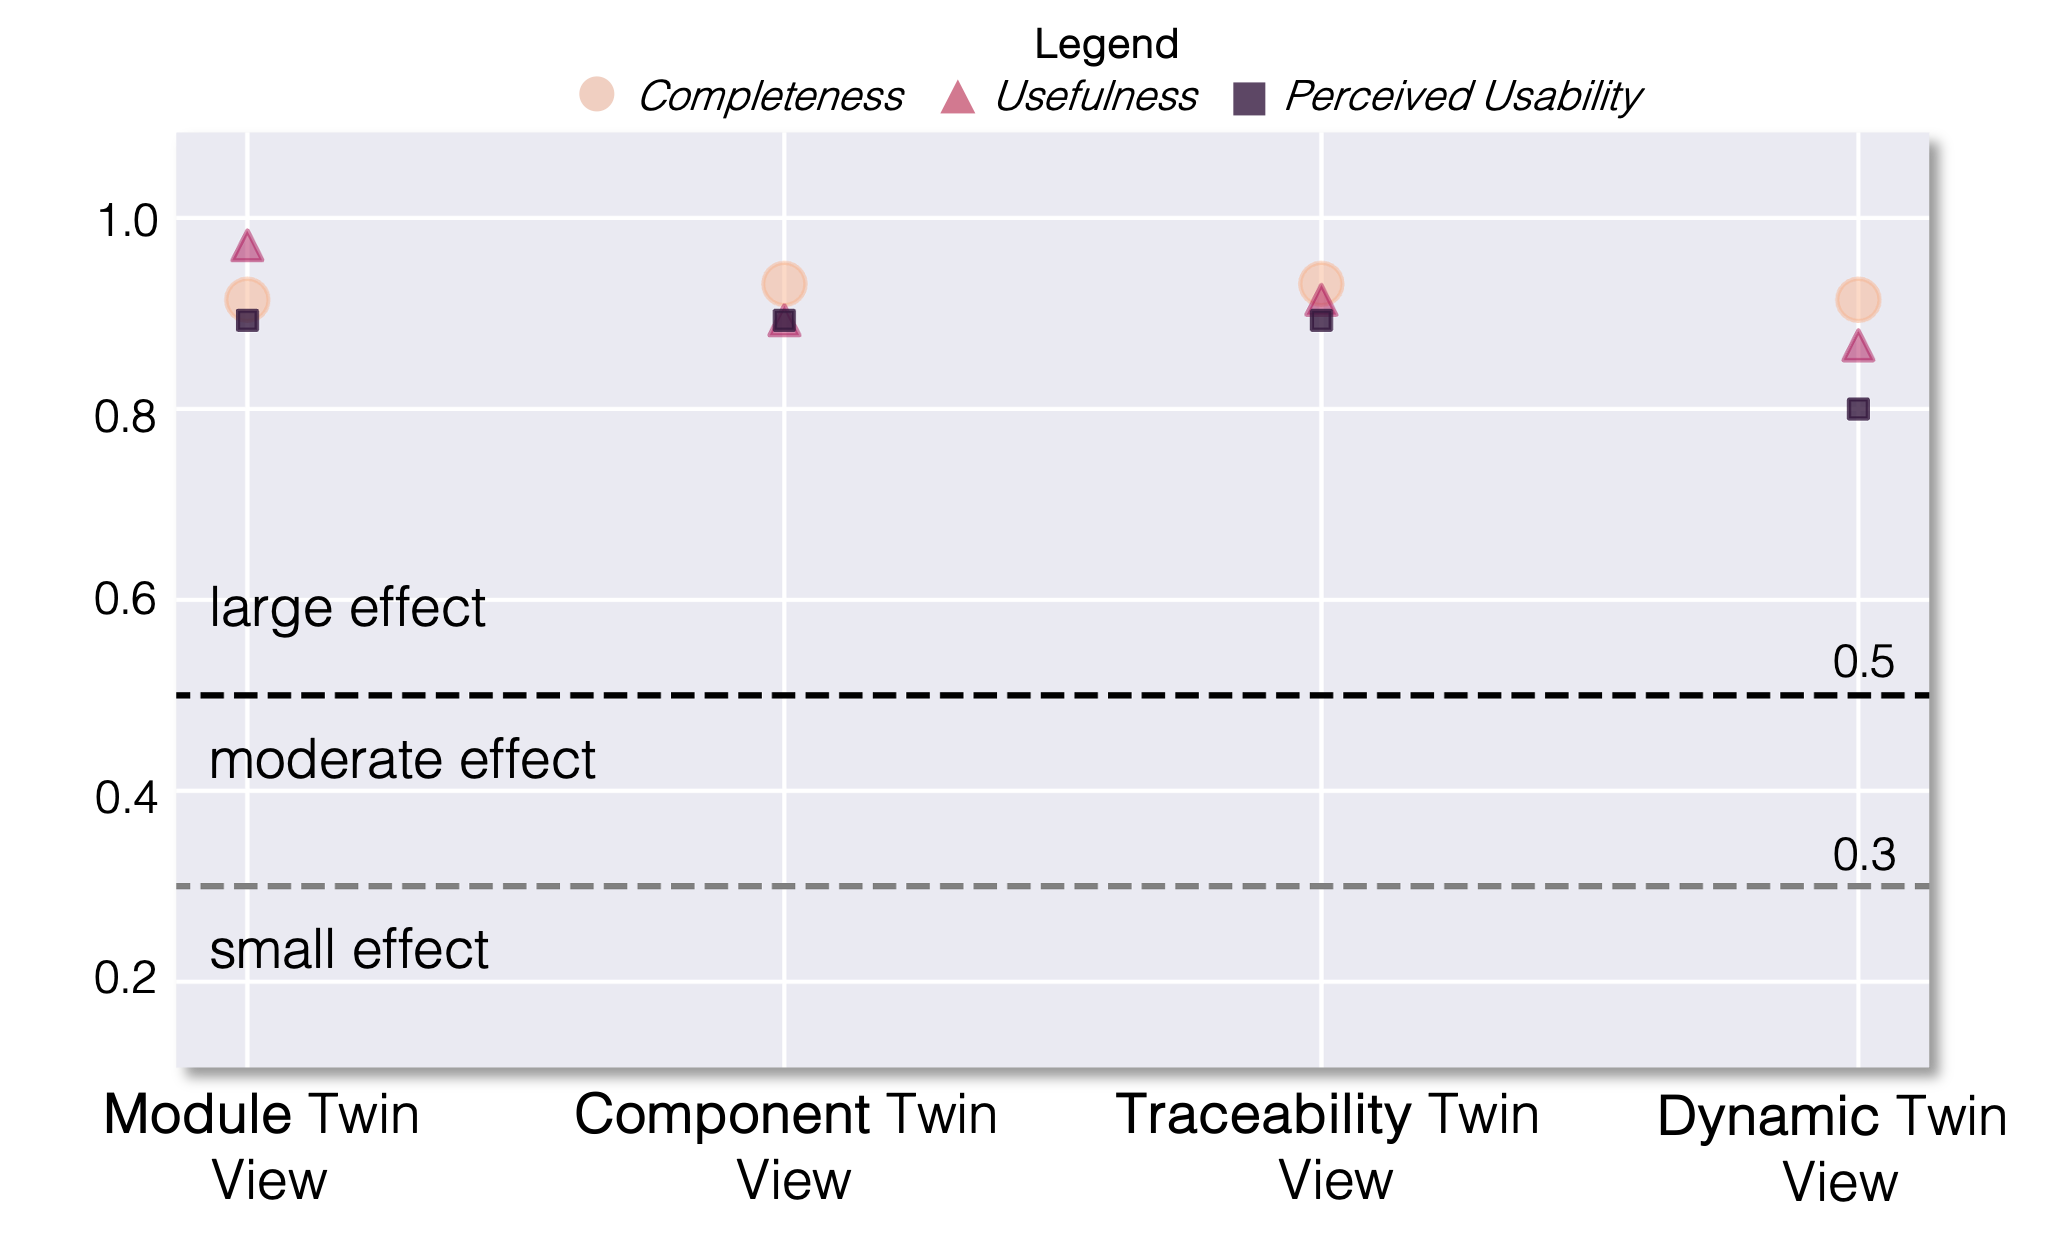
Figure 3: Effect size showing practical significance of responses.